OmniGate
Project, 2026
- Timeline
- 5 days, Jul 2026
- Tools
- Python, FastAPI, React, TypeScript, Claude API, scanpy
Overview
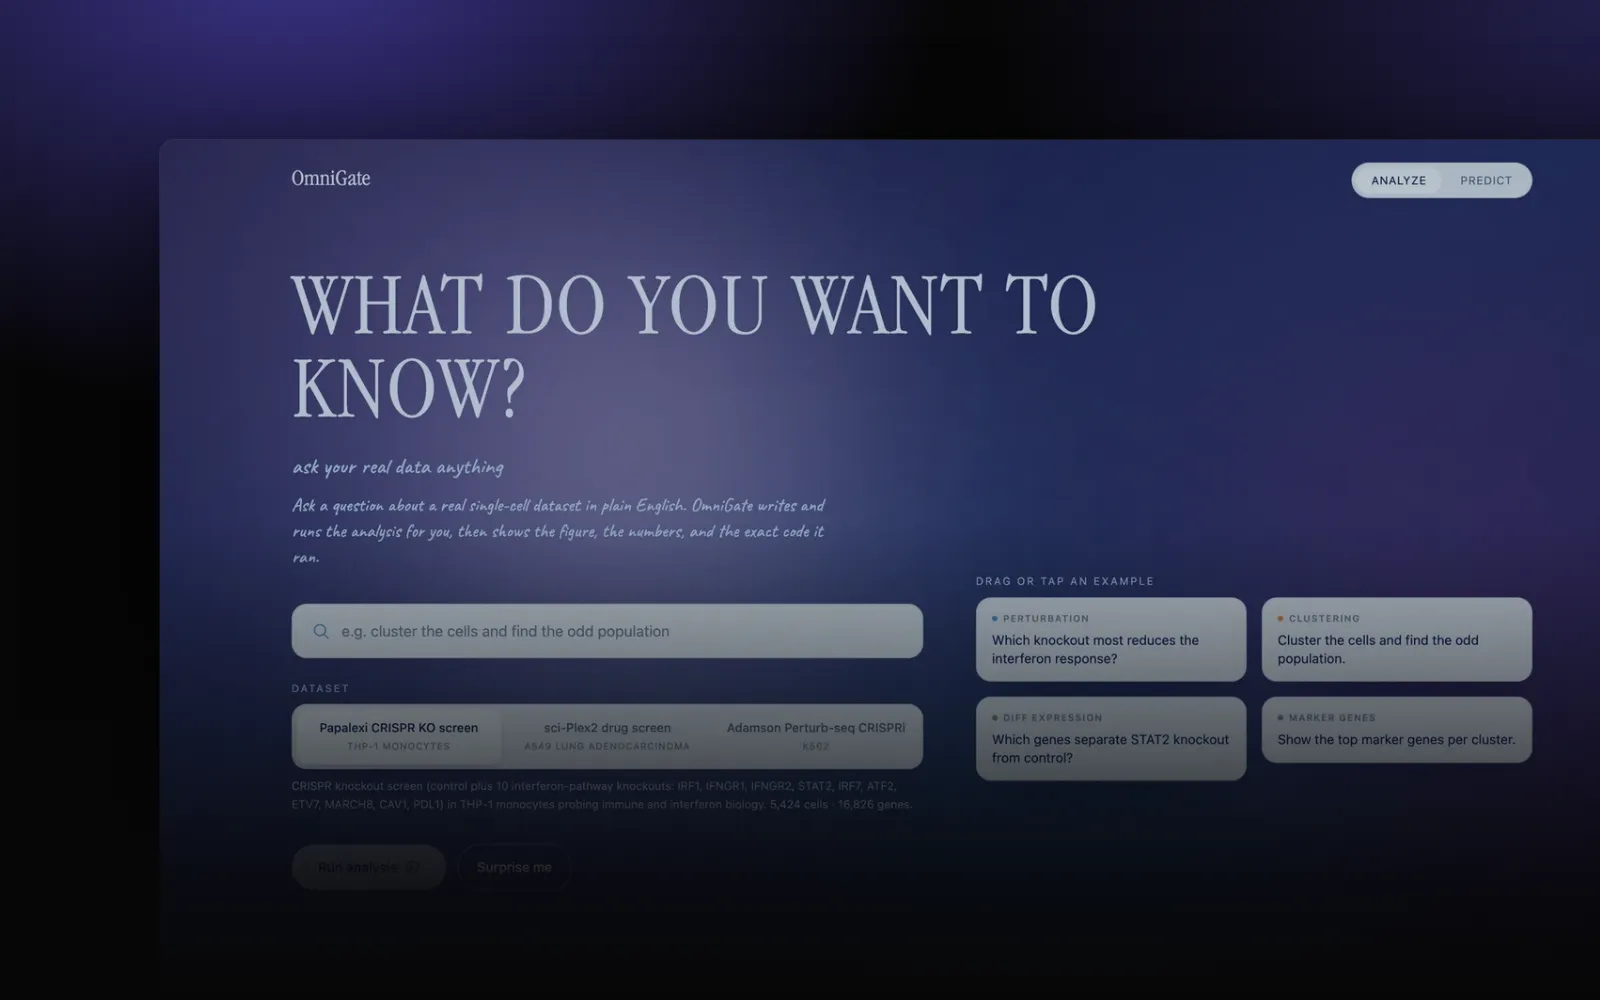
You ask a real single-cell dataset a question in plain English. OmniGate writes the Python, runs it on the data in a sandbox, and shows the figure, the numbers and the code it ran. It can also predict perturbations nobody has measured, and it grades its own reliability. It is a hackathon prototype (Anthropic x Gladstone).
Background
A lot of LLM data tools produce an answer that looks right and leave the checking to you. OmniGate runs on one rule: every number on screen is computed from real data. The model chooses what to compute and which measured perturbations to reason from. It never invents a measurement.
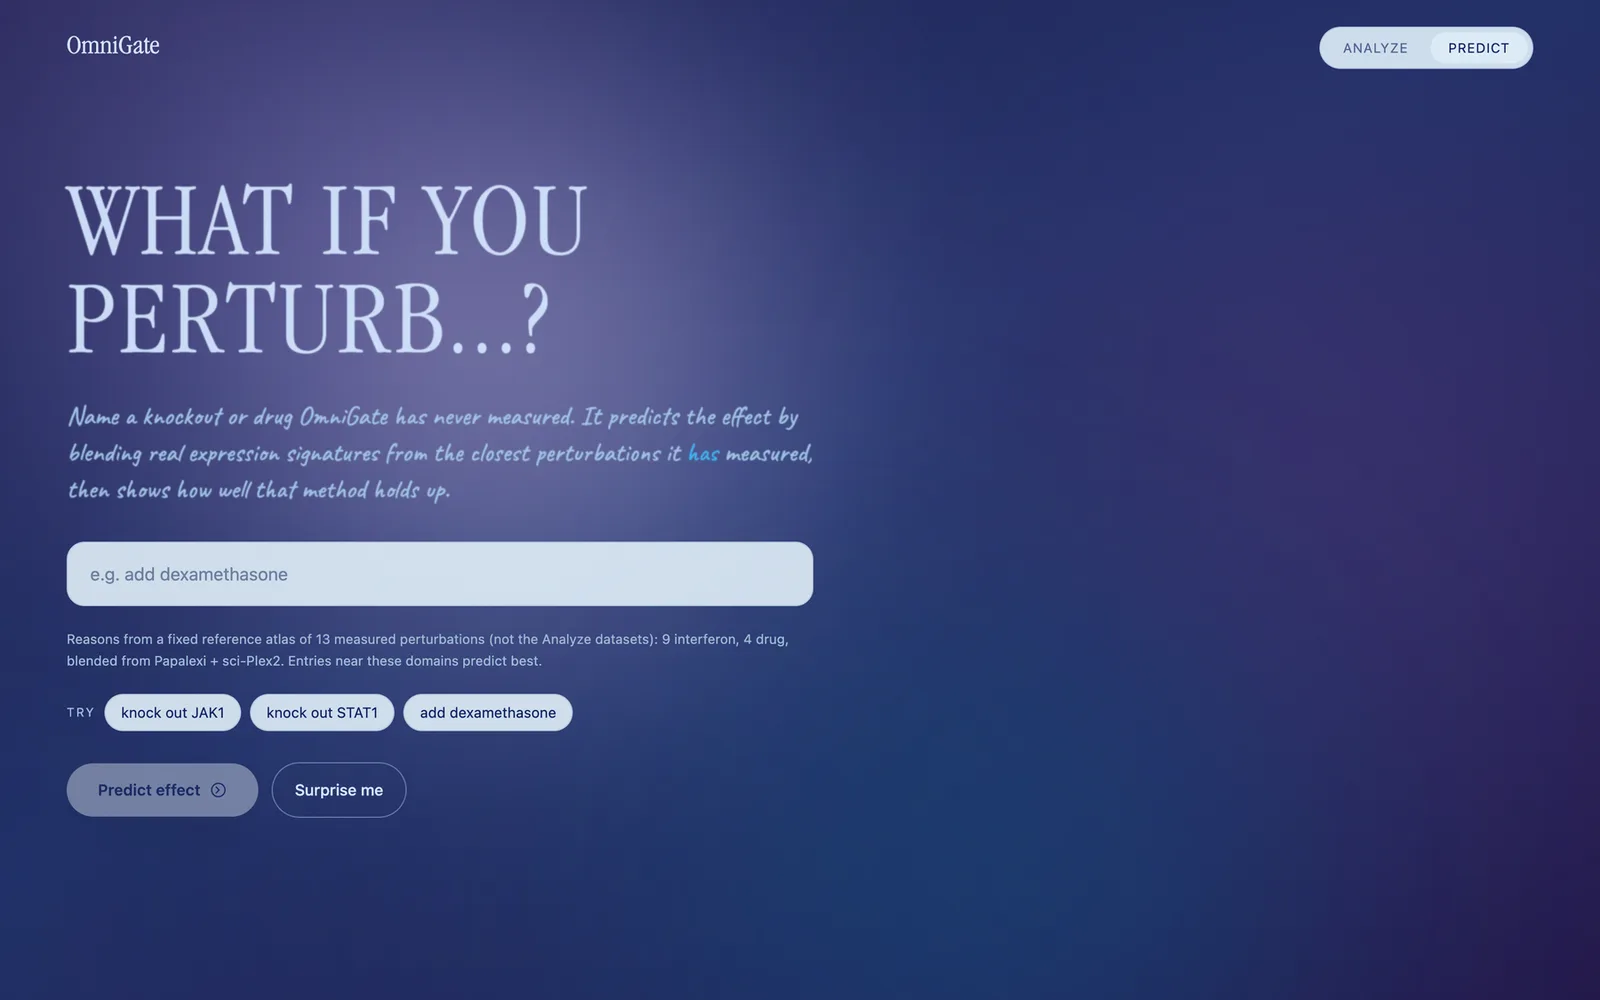
It has two modes. Analyze turns a question into Python and executes it against a real dataset. Predict estimates the effect of a gene knockout or a drug that was never measured by blending the real signatures of the closest perturbations that were. Then it shows a self-audit, so you can see how far to trust the estimate.
The data comes from three published perturbation screens, accessed through scPerturb: Papalexi (CRISPR knockouts in THP-1 monocytes), sci-Plex2 (a drug screen in A549 cells) and Adamson (a CRISPRi screen in K562 cells).
Architecture
The backend is FastAPI with the Anthropic SDK and scanpy. The frontend is React and TypeScript. Analyze streams Server-Sent Events, so you watch the code get written and run.
Confidence combines three signals: how well the chosen analogs agree with each other, whether they share a biological domain, and how well that domain did in the audit. It is conservative on purpose. On noisy single-cell signatures it says medium far more often than high.
The hard parts
Running code a model wrote
Analyze executes Python that Claude writes, so the first line of defence was an AST allowlist that rejects code before it runs, followed by a separate subprocess to run it in. The final review found a way past it through builtins reflection, and the fix was a guarded importer. The child process also runs with reduced builtins, POSIX resource limits, a wall-clock timeout, and an environment with the API key and anything else that looks like a secret removed. That last layer works on its own: even if another reflection route turned up, the key would not be there to read.
The chart that showed the same genes every time
A live test showed the gene chart drawing the same alphabetical wall of genes at the clip limit for every query. About 136 genes in the blended vector sat at the cap, artifacts from low-expression loci. Ranking all 13.8k genes by size surfaced only that junk and buried the real signal, genes like MX1 and CXCL10. The fix ranks genes only within the analogs' own significant, QC-filtered gene lists and drops anything still at the cap. Real interferon and MHC genes now come through, with the right directions, and they change from query to query.
Testing the part that is the product
The first audit design used cosine-nearest neighbours. That only showed the overlap metric was nontrivial. It never asked whether Claude's choice of analogs beats chance, and choosing analogs is what Predict does. The audit that shipped runs three arms over the same held-out perturbations: random analogs as the floor, Claude's blind picks as the real pipeline, and cosine neighbours as an oracle ceiling. It reports a bootstrap confidence interval on the gap between Claude and random, not a single number.
Honest limits
- The sandbox is a subprocess with limits on the same machine. It is not a separate container.
- The Predict atlas is small: 13 measured perturbations from Papalexi and sci-Plex2. Adamson is left out because its control could not be verified.
- Claude beats random analogs in the audit, but not by much (numbers below).
- There is no hosted demo. Running it needs an Anthropic API key and the scPerturb data files, which are not in the repo.
Results
Over the 13 held-out perturbations, the predicted genes moved in the right direction 73.2% of the time on average when Claude picked the analogs, against 69.2% with random analogs. The 95% confidence interval on that gap runs from 0.15 to 8.3 points. It excludes zero, but only just. The app shows this number to every user, good or bad.
When the audit landed, the project had 190 passing backend tests and 134 frontend tests.
Takeaways
An audit is only worth showing if it measures what users get. My first audit design tested the metric. The one that shipped tests Claude's picks against random ones, because the picks are the product.
The sandbox needed layers that fail independently. The allowlist alone had a hole, and with the environment scrubbed, the key is not in the child process even if another hole turns up.